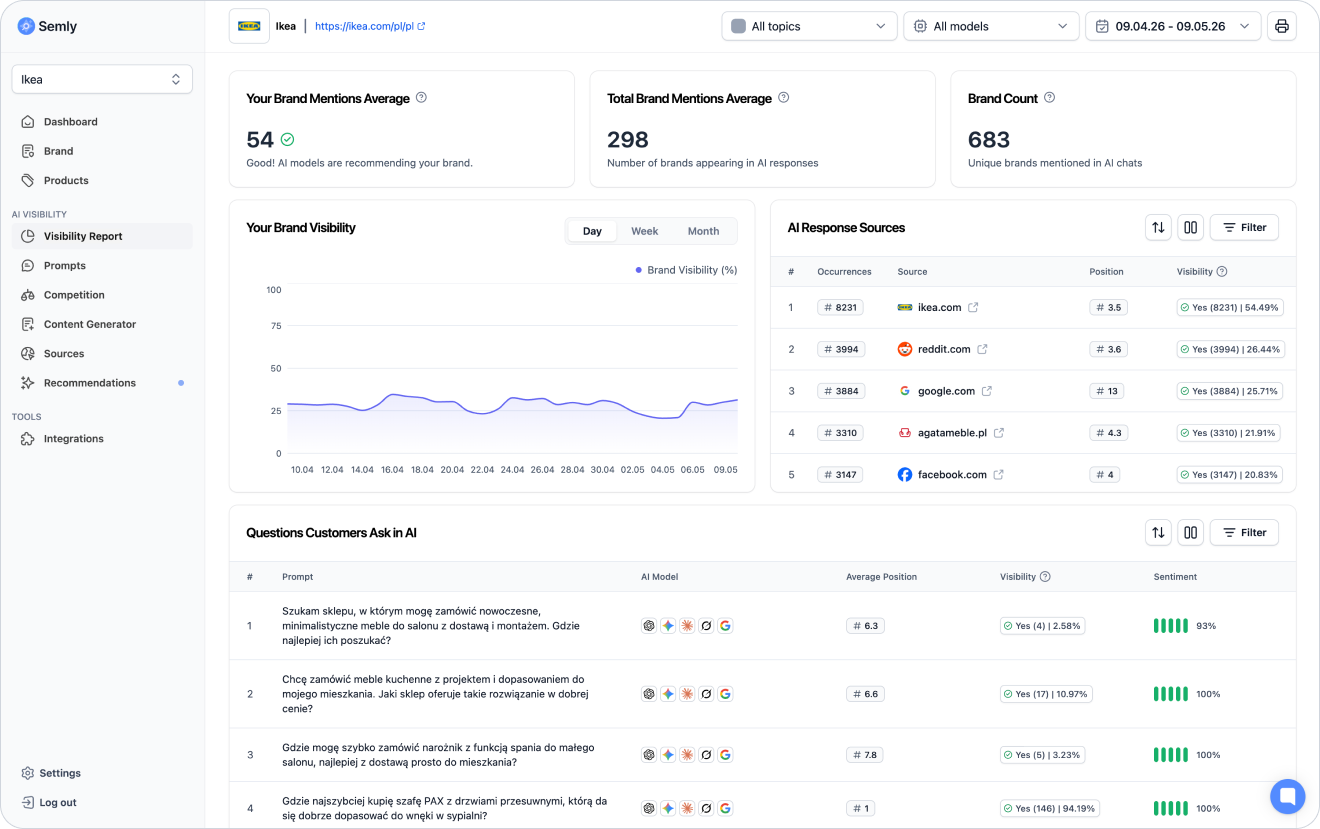
The visibility report is the main analytics hub in Semly. It shows whether your brand is visible in AI model answers, what kinds of questions it appears for, how it compares to the competition, and which sources the models use when generating answers.
Thanks to daily reports you can check not only your brand’s presence in AI, but also its position, sentiment, share in answers, and how its visibility changes over time.
The visibility report helps you answer the key questions about your brand’s presence in AI:
does AI mention your brand
how often does the brand appear in the answers
with which prompts is the brand visible
in which position does the brand appear
does AI describe the brand positively, neutrally, or negatively
what sources influence AI’s answers
which brands appear next to your brand
how does visibility change over time

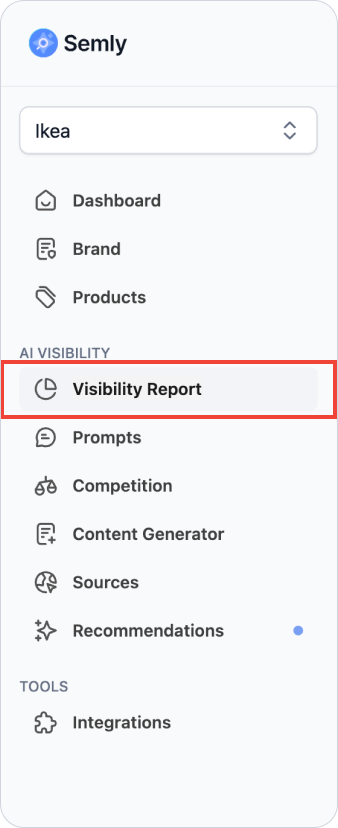
To go to the report:
Log in to the Semly panel
Choose the right project
Go to the Visibility report
Check the main metrics and charts
Open the details of selected prompts, sources, or competitors
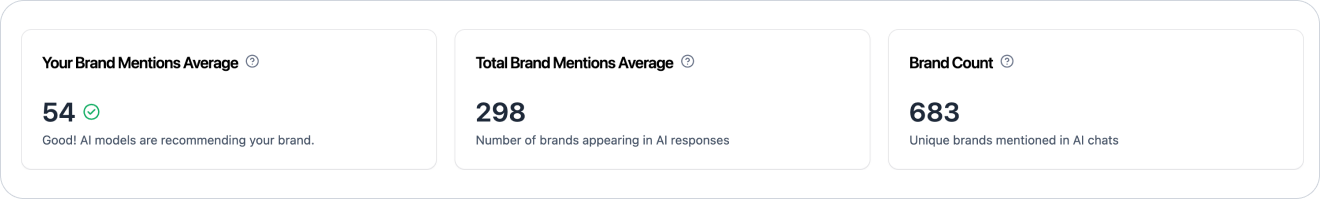
At the top of the report you’ll find the most important summary of the results. The cards show the overall situation of the brand in the analyzed data range.
Depending on the project configuration, among others, you may see:
number of mentions of your brand
number of mentions of all brands
number of brands detected in AI answers
data about visibility change over time
basic information about the analyzed scope
Shows how often your brand appears in the analyzed AI answers.
If the result is low, it may mean that AI models rarely mention your brand for the monitored queries.
Shows how many brands appear on average in AI answers. This metric helps you understand how competitive a given answer space is.
If AI often mentions many brands, it means the user gets more choice and the fight for visibility can be more competitive.
Shows how many different brands were detected in the analyzed AI responses.
The more brands appear in the answers, the more important it becomes to check the position, sentiment, and share of your brand compared to the competition.
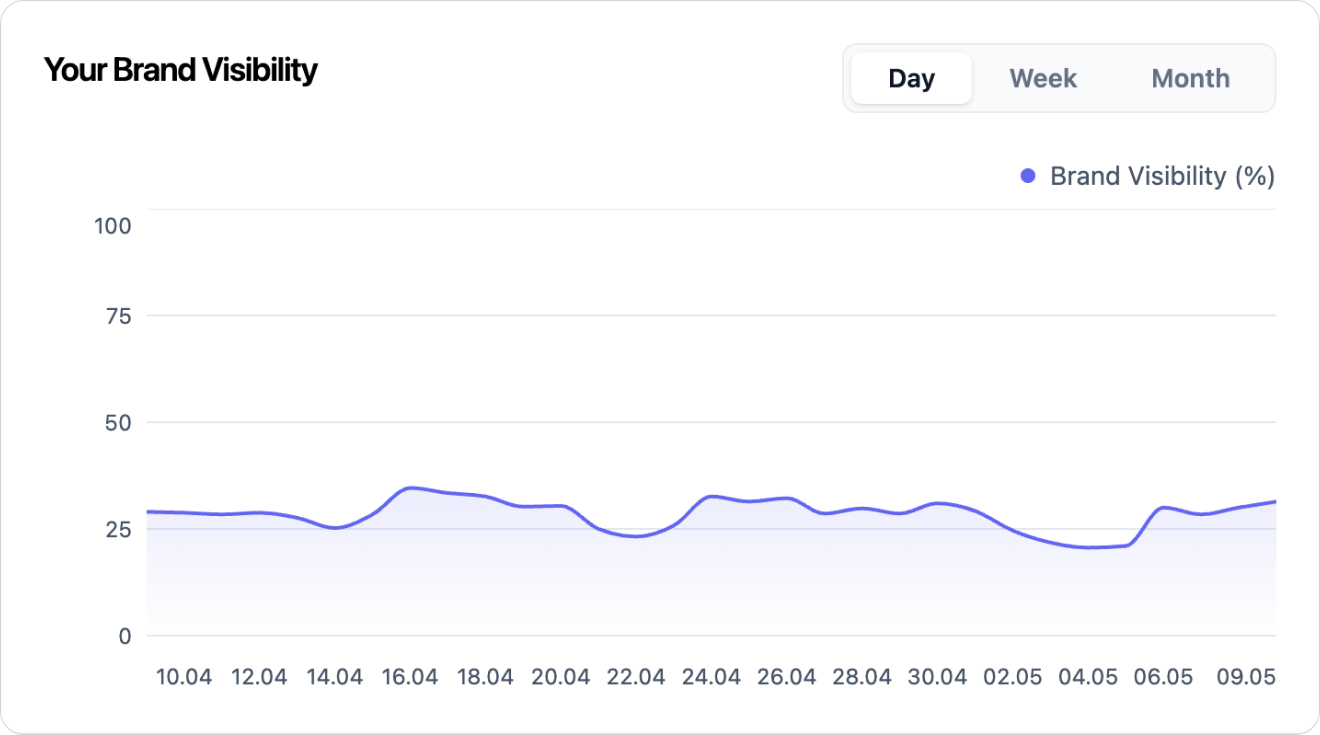
The visibility chart shows how your brand’s presence changes over time.
With it, you can check whether visibility:
is growing
is dropping
stays stable
changes after implementing the recommendations
reacts to new content
differs between periods
The chart helps distinguish individual fluctuations from the long-term trend.
An increase in visibility can mean that your brand shows up more often in AI answers for the monitored prompts.
This can be caused by, among other things:
a better filled-out brand profile
improved product data (online stores only)
new content
better site accessibility for AI bots
presence in important sources
changes in AI model answers
implemented recommendations
A drop in visibility doesn’t always mean there’s an error. AI answers can change over time.
Worth checking:
whether the drop concerns a single prompt or many prompts
whether the drop occurred in one model or in several models
whether the competition gained visibility at the same time
whether the sources of answers have changed
whether the page or product file are still available
whether there are new recommendations to implement

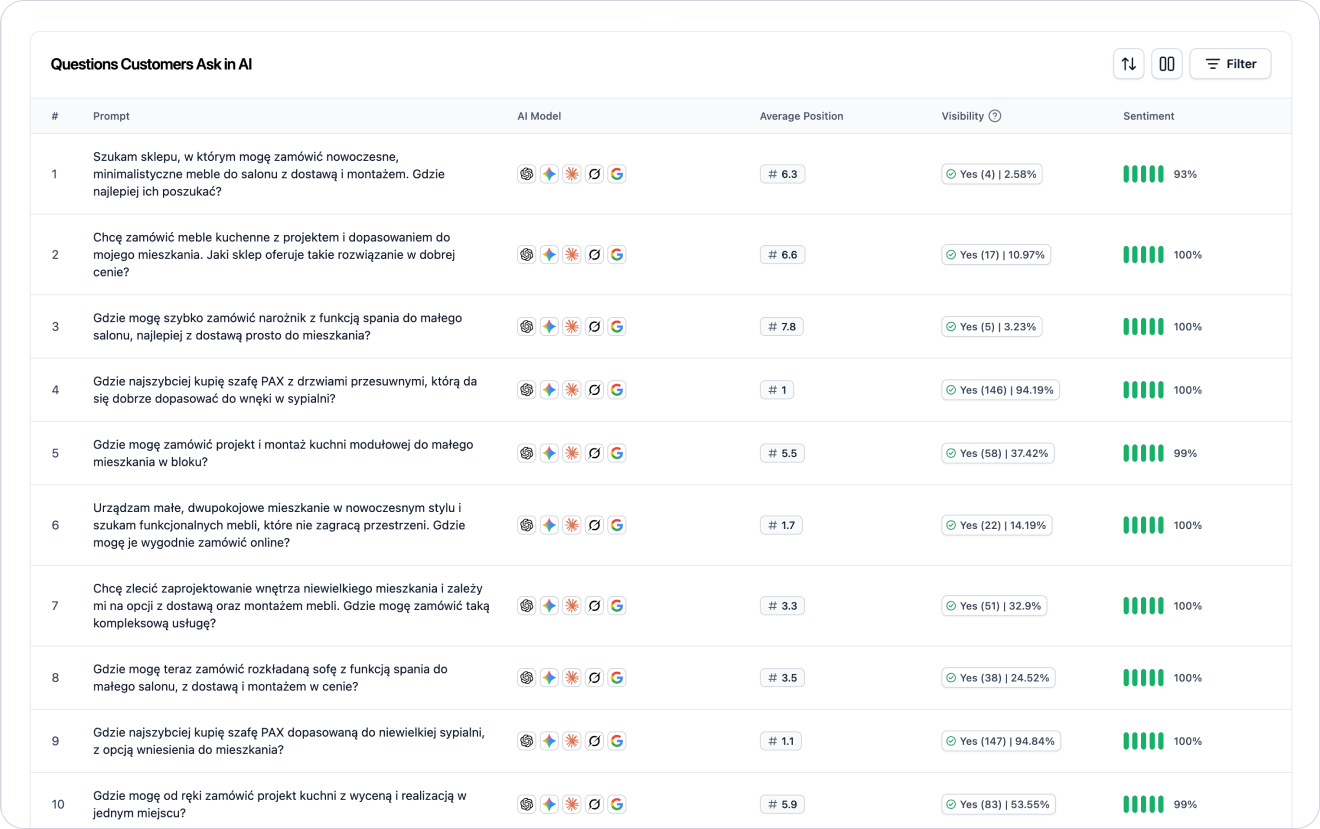
In the report you’ll find a list of prompts, meaning questions analyzed by Semly.
This is one of the most important parts of the report because it shows for which questions your brand is visible or skipped.
In the prompts table you can check:
prompt content
your brand’s position
visibility
sentiment
topic
status
AI model
date or analysis range
Position shows in which place your brand appears in the AI’s answer if the model lists several brands, stores, products or solutions.
Example:
Competitor A
Your brand
Competitor B
In this case, your brand is in position #2.
#1 means the brand is the first recommendation
#2-#3 means high visibility but not full dominance
#4 and lower means the brand is visible but may be less noticeable to the user
no position means the brand wasn’t detected in the answer

Prompt visibility shows how often your brand appears in AI answers for a specific question.
Example:
If the visibility for a prompt is 40%, it means that the brand was detected in 40% of the analyzed answers for that question.
High visibility for an important prompt means that the AI often takes your brand into account in that context.
Low visibility can mean that:
the AI doesn’t yet associate the brand with that question
the competition has stronger sources
the site is missing content that answers this question
the product data is too generic (only online stores)
the brand profile needs to be more precise
it’s worth creating content or implementing the recommendation
Sentiment shows in what context the AI describes your brand.
It can be:
positive
neutral
negative
AI describes the brand favorably, points out its advantages, or recommends it as a good solution.
AI mentions the brand, but without a clear evaluation or recommendation.
AI points out problems, limitations, lack of data, or poor fit of the brand to the user’s question.
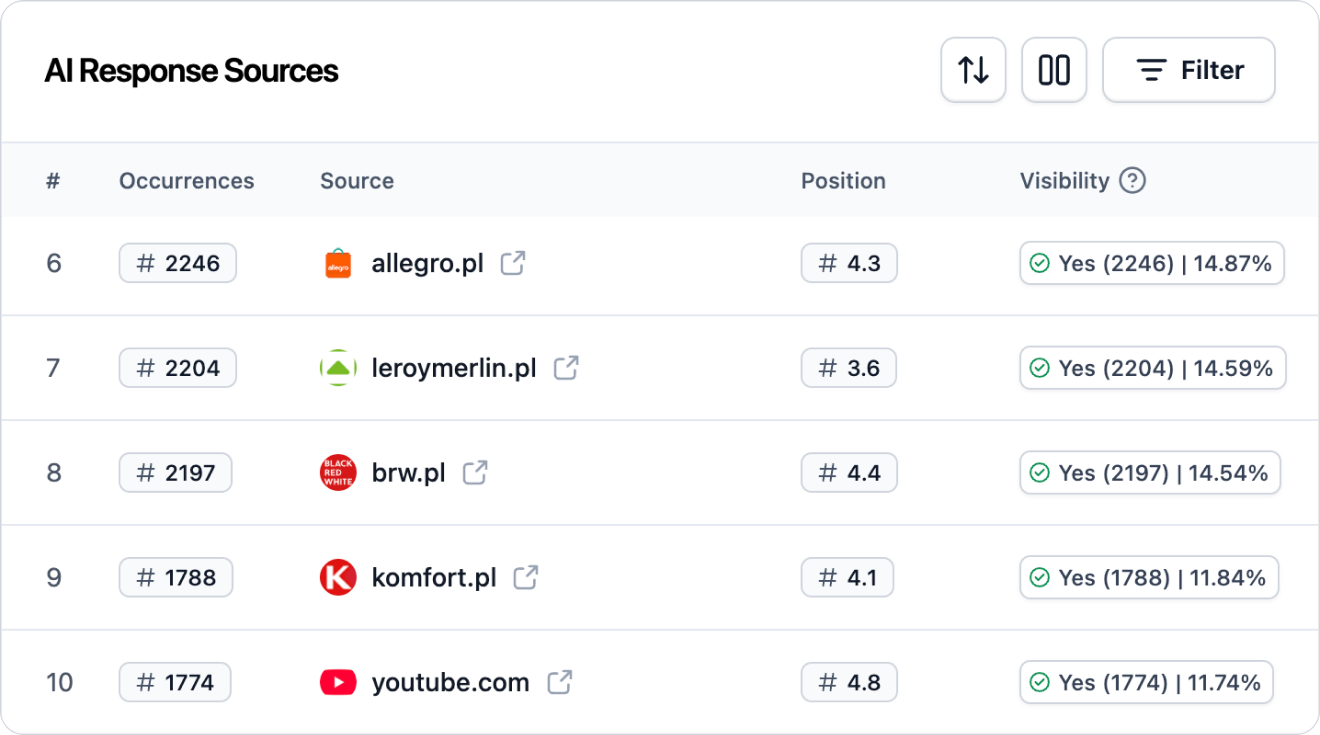
The sources section shows which domains, pages, and materials AI models use when generating answers.
Sources are important because they help you understand why AI recommends specific brands.
In the report you can check:
which domains appear most often
which sources support AI answers
whether your site is visible as a source
whether competitors show up in sources more often than your brand
what types of content are used by AI models
Example sources may include:
brand pages
blog articles
rankings
directories
forums
reviews
product pages
category pages
industry media
Filters help narrow down the analysis to a specific data range.
Depending on the view, you can filter the report by:
date range
AI model
topic
position
visibility
source
With filters you can check, for example:
how does the brand perform in a specific AI model
is visibility growing in the last few days
which topics have the best results
where does the competition show up more often
which sources influence the answers in a given category
If you don’t know where to start, use a simple analysis framework.
See if your brand appears in AI answers and whether visibility is going up or down.
Pick the questions that matter most for sales or strategy.
See if the brand is one of the first recommendations or only shows up further down.
Assess whether AI describes the brand in a positive, neutral, or negative way.
See which brands show up for the same prompts and whether they rank better.
See which websites AI models use and whether your brand is present in those sources.
If the report shows gaps, check Semly’s recommendations and start with the highest-priority tasks.
Let’s say that for an important prompt your brand has a low visibility score, while a competitor shows up often and has a strong position.
Possible interpretation:
AI associates the competitor better with this particular user problem
the competitor has more or better sources on this topic
your website doesn’t answer this question clearly enough
product or service descriptions are too generic
there’s not enough educational or comparison content
it’s worth creating an article or knowledge base tailored to this prompt
Possible actions:
check the prompt details
analyze AI models’ answers
check the competitor’s sources
improve the brand profile
fill in the product data
generate content in the Content Generator
apply Semly’s recommendations
Try not to interpret the report too superficially.
The most common mistakes are:
evaluating results after just one day
analyzing only overall visibility
skipping brand position
ignoring sentiment
no source analysis
no comparison with the competition
focusing on prompts with low sales value
not taking into account differences between AI models
not implementing recommendations after the analysis

After reviewing the report, move from data to action.
First of all:
choose prompts with the greatest business impact
check where the brand doesn’t appear at all
compare the results with the competition
analyze the sources of AI answers
check Semly’s recommendations
fix your brand or product data
prepare content for the most important gaps
monitor changes over the next days and weeks
Key metrics
How to read results and metrics in Semly. A guide to brand visibility analytics in AI answers.
How to analyze prompt details
Learn how to read prompt details in Semly and check why your brand appears or doesn’t appear in AI answers.
How to interpret AI model answers
Learn how to analyze real AI model answers in Semly and check whether your brand is being correctly described, recommended, and understood by artificial intelligence.
How to add competitors
Learn how to add competitors in Semly and how to use competitor analysis to check your brand’s visibility in AI answers.
What AI answer sources are
Learn what sources are in Semly and why they matter a lot for brand visibility in AI answers.
How to read Semly recommendations
Learn how to use Semly recommendations and turn AI analysis results into concrete actions that improve your brand’s visibility.
The visibility report shows how your brand works in AI answers. It lets you check whether the brand is mentioned, for which questions it appears, what position it has, what sentiment it gets, and which sources influence the models’ answers.
Key rules:
analyze the report regularly
check trends, not just single days
combine visibility with position and sentiment
check the sources of AI answers
compare the results with the competition
start with prompts that matter most for the business
regularly implement Semly’s recommendations