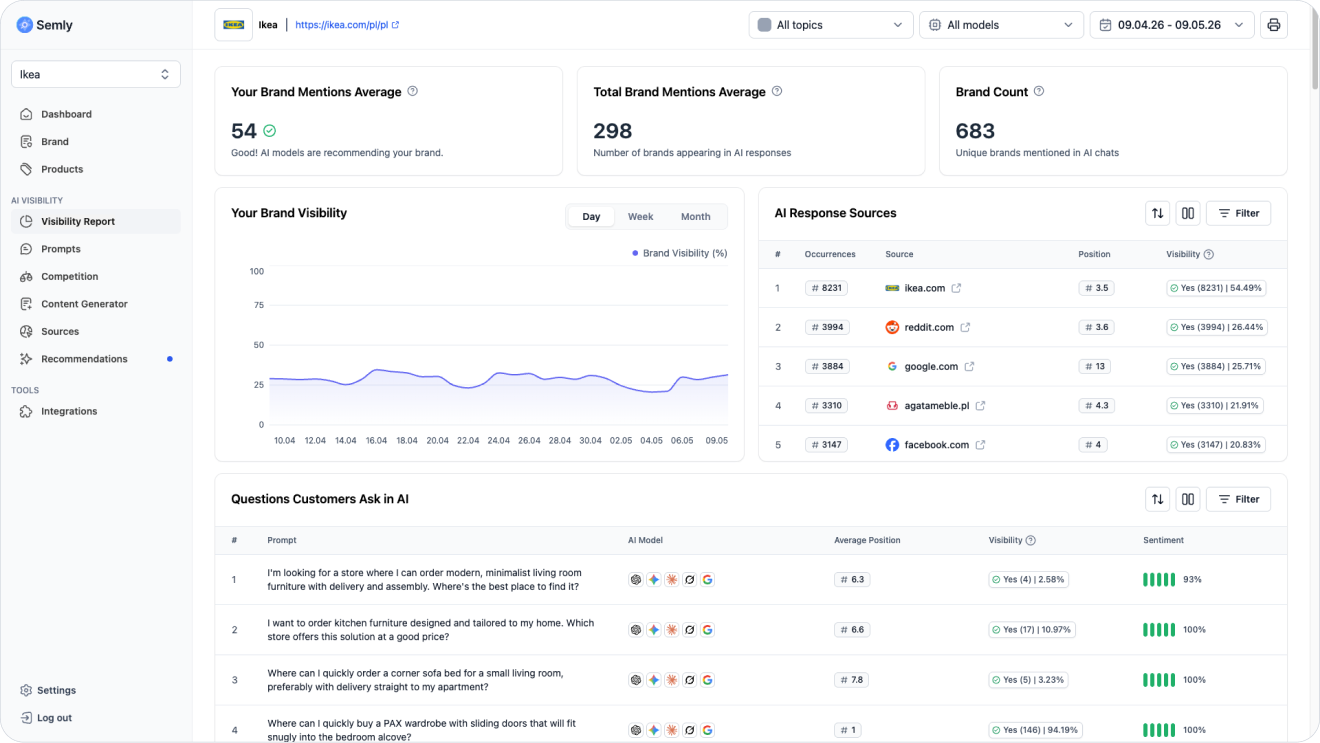
The main metrics in Semly help you understand how your brand shows up in the answers of AI models like ChatGPT, Gemini, Claude, Grok, or Google AI.
With them, you can check not only whether the brand was mentioned, but also how often it appears, in which position it shows up, what sentiment it’s described with, and how it compares to the competition.
In Semly, the most important metrics help answer five questions:
Does AI mention my brand
How often does the brand appear in answers
In which position is it recommended
Is the context of the answer positive, neutral, or negative
How big is my brand’s share compared to the competition and other sources
The most important metrics are:
Visibility
Share of Voice, or SOV (your brand’s share compared to the competition)
Position
Sentiment
Funnel
Sources
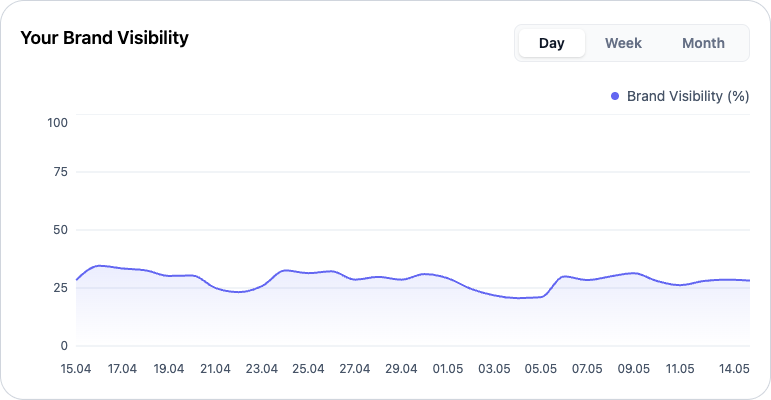
Visibility shows in what percentage of analyzed AI responses your brand appeared.
If visibility is 20%, it means your brand was mentioned in 20% of the responses analyzed for the selected data range, e.g. for a specific prompt, topic, AI model, or period.
Example:
Visibility = number of responses mentioning the brand / total number of responses × 100%If Semly analyzed 100 responses and your brand appeared in 20 of them, visibility is 20%.
High visibility means that AI models often recognize and mention your brand in the analyzed questions.
Low visibility can mean that:
AI doesn’t know your brand in a given context yet
your competitors have stronger sources
your content doesn’t answer a given question very well
your product data or brand description is too generic
AI models use other domains as sources for answers
Share of Voice, or SOV, shows the share of your brand, source, or competitor in the analyzed AI answers compared to other brands or sources.
In practice, SOV answers the question:
How big a part of AI visibility does my brand take compared to others?
Example:
If a given set of AI answers contains a total of 100 occurrences of different brands, and your brand appeared 25 times, its SOV is 25%.
SOV = number of brand mentions / number of mentions of all analyzed brands × 100%Visibility shows in how many answers your brand appeared.
SOV shows what share your brand has in the whole space of answers compared to other brands or sources.
Example:
Visibility says: “Your brand appeared in 30% of answers”
SOV says: “Your brand accounts for 18% of all brand occurrences in the analyzed area”
SOV is especially useful when analyzing competition and sources.
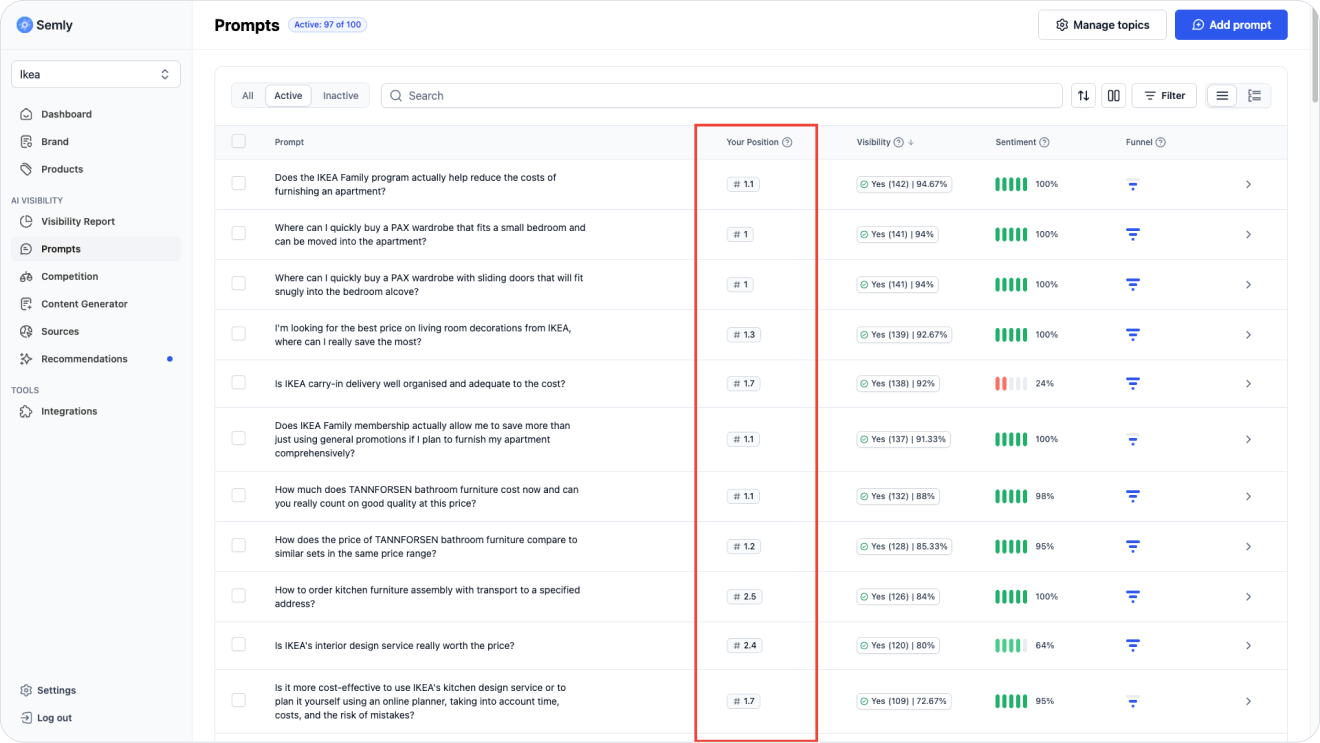
Position shows in which place your brand appears in the AI response when the model lists several brands, products, stores, or solutions.
Example:
If the AI responds:
Brand A
Your brand
Brand C
then your position is #2.
The lower the position number, the better.
#1 means that the brand appeared as the first recommendation
#2-#3 means high visibility, but not full dominance
#4 and lower may mean that the brand is noticed, but is not the main recommendation
No position means that the brand was not mentioned in the answer
It’s worth analyzing position together with visibility. A brand can appear often, but in lower positions. It can also appear less frequently, but very high for the most important prompts.
Sentiment shows the tone in which AI describes your brand.
In Semly, sentiment helps you understand whether the brand appears in answers in a positive, neutral, or negative context.
Examples:
Positive sentiment: AI recommends the brand, points out its advantages or how it matches the user’s needs
Neutral sentiment: AI mentions the brand, but without a clear recommendation or evaluation
Negative sentiment: AI points out limitations, problems, lack of data, or poor fit
High sentiment is a good sign, but it shouldn’t be analyzed separately from visibility and position.
Example:
High sentiment and high position is a very good result
High sentiment but low visibility means that AI describes the brand well, but does it too rarely
Low sentiment with high visibility means that the brand is known, but might be described in an unfavorable context
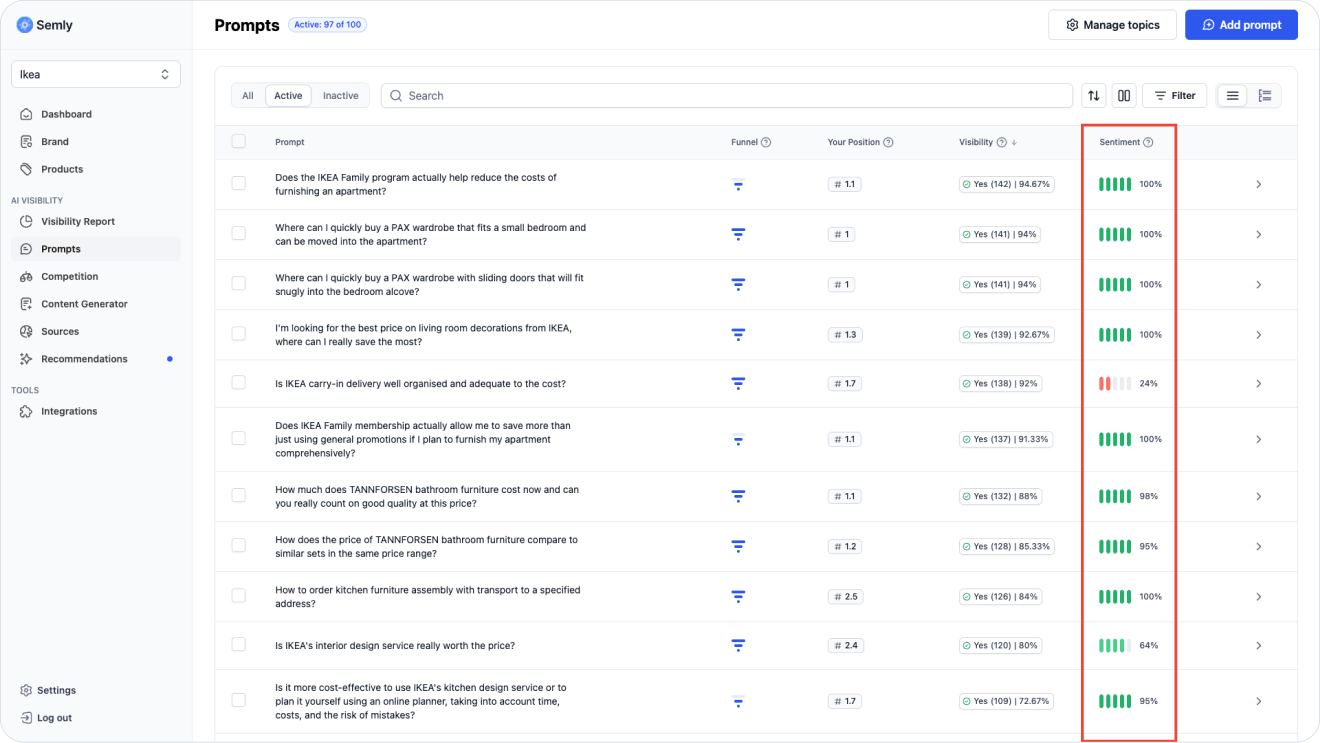
Funnel helps determine what stage of the decision process the user asking a given question is at.
Not every prompt has the same sales value. Some questions are general, and some show a high readiness to buy.
Example stages:
The user is looking for general information.
Example:
How to arrange a small apartment?
The user is comparing options, brands, or stores.
Example:
Which furniture store offers a good price-to-quality ratio?
The user is close to making a purchase decision.
Example:
Where to buy a bed with storage with delivery this week?
Prompts from the lower stage of the funnel build awareness. Prompts closer to the purchase decision can have a bigger impact on sales.
That’s why it’s worth analyzing the metrics not only globally, but also by funnel stage. Low visibility for purchase-focused prompts can be a more important problem than low visibility for very general questions.

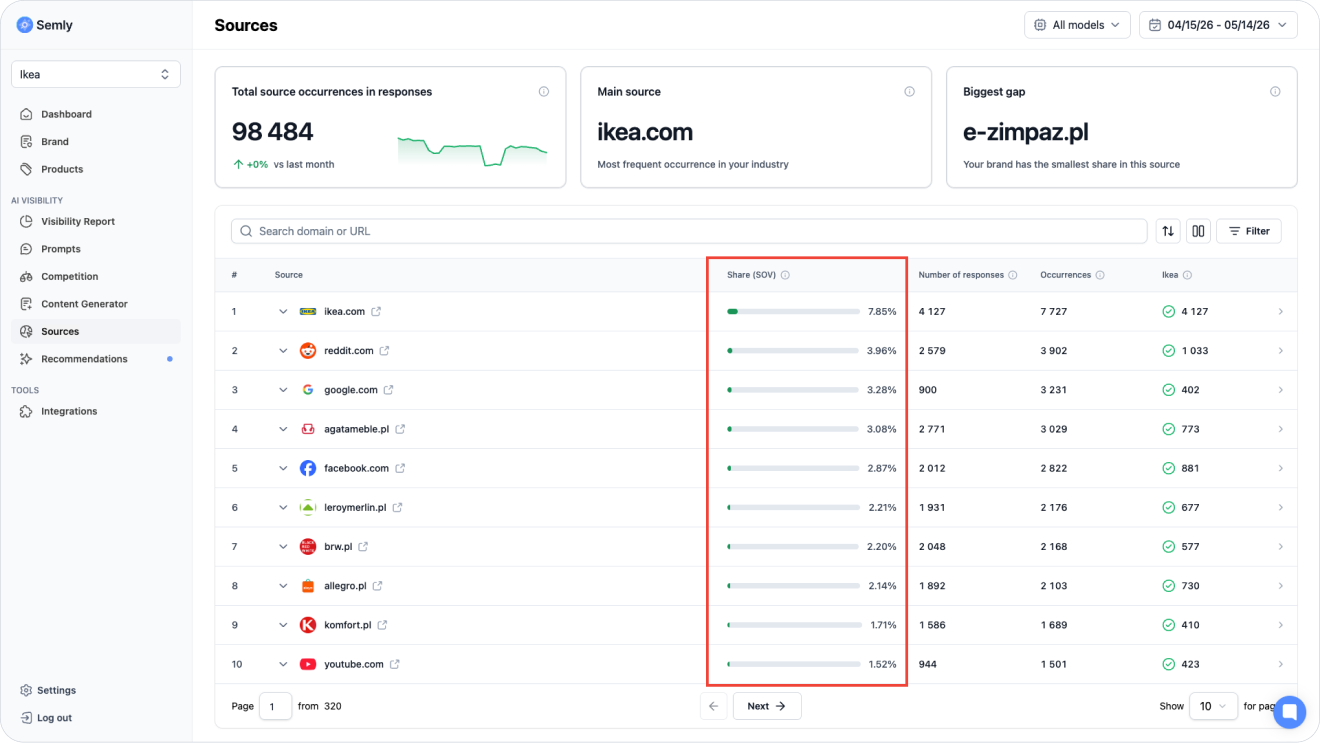
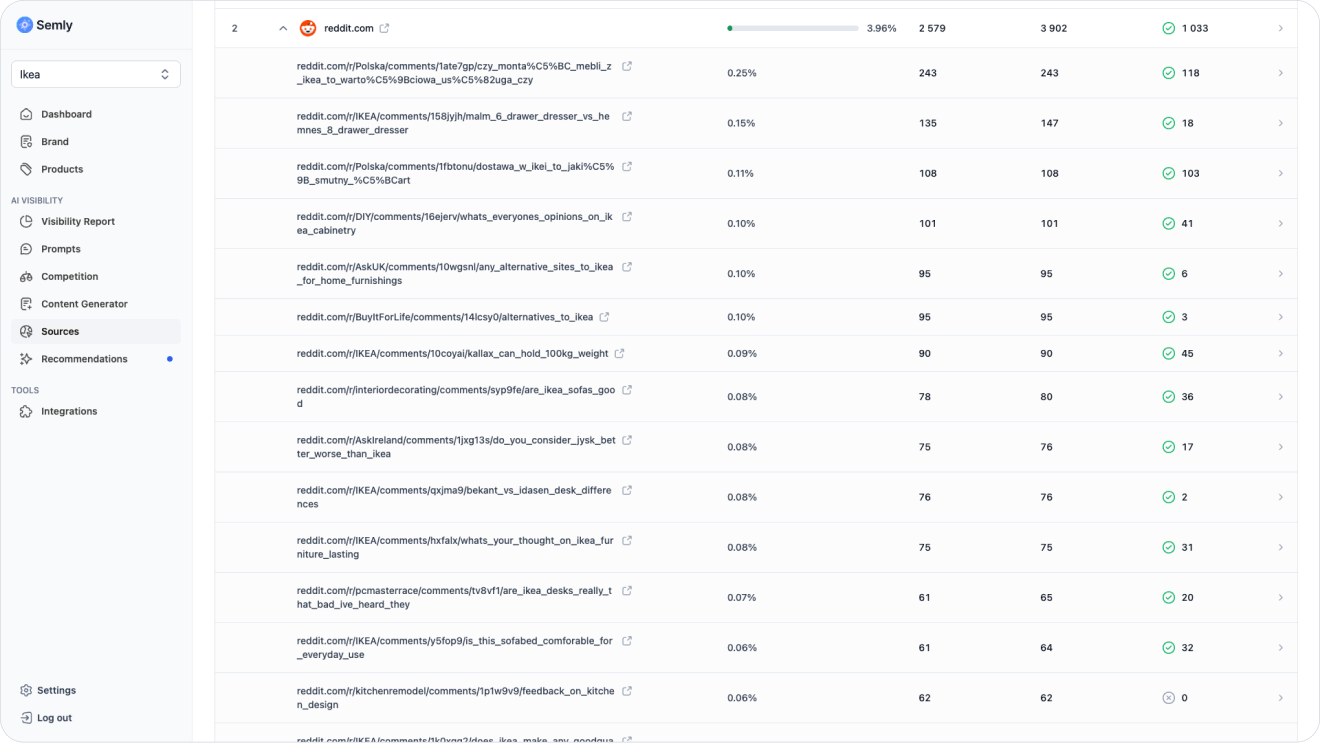
Sources show which domains, pages, and materials AI models use when generating answers.
This is an important metric, because AI models often base their answers on information available in external sources, such as brand websites, articles, rankings, forums, catalogs, reviews, or industry media.
In the sources section you can check, among other things:
which domains show up most often
what the share of the source is, i.e. SOV
how many times the source appeared
how many answers were linked to the source
whether your brand appears for a given source
which other sources appear together with the source being analyzed
Sources help you understand why AI recommends specific brands.
If your competitors show up often, check which sources support them. It may turn out that AI is using rankings, guides, category pages, forums, or reviews where your brand isn’t mentioned.
You get the most value by combining several metrics instead of looking at just one number.
Examples of interpretation:
AI often mentions the brand, but doesn’t treat it as the main recommendation. It’s worth checking whether the content and sources clearly show the brand’s advantages.
AI describes the brand well when it does mention it, but it happens too rarely. It’s worth increasing the amount of content, improving product data, and checking the sources.
Competitors take up a bigger share of AI answers. It’s worth checking which prompts they win on and what sources support them.
The brand is present at the education stage, but doesn’t show up where the user is close to making a decision. It’s worth preparing content and data for bottom-of-the-funnel prompts.
The main metrics in Semly let you measure brand visibility in the AI environment in a similar way to how classic SEO tools measure visibility in search engines.
The difference is that in AI it’s not just about the brand showing up, but also:
whether the model recommends it
how it describes it
in which position it shows it
which sources it uses
whether competitors show up more often
whether the brand is visible for purchase-related questions
This way you can more quickly see where the brand has an advantage, where it’s losing visibility, and which actions are worth taking first.
After going through the main metrics, move on to the next articles:
Jak czytać Raport widoczności
Dowiedz się, jak analizować Raport widoczności w Semly i sprawdzać, jak Twoja marka pojawia się w odpowiedziach AI.
How to create prompts and topics
Find out what prompts are in Semly, how to create good questions for AI monitoring, and how to organize them into topics.
How to add competitors
Find out how to add competitors in Semly and how to use competitor analysis to check brand visibility in AI answers.
What AI answer sources are
Find out what sources are in Semly and why they matter a lot for brand visibility in AI answers.
How to read Semly recommendations
Find out how to use Semly recommendations and turn AI analysis results into specific actions that improve brand visibility.
How to generate your first article
Find out how to generate your first article in Semly and use it to build brand visibility in AI answers.
How to generate the first article
Find out how to generate the first article in Semly and use it to build brand visibility in AI answers.
These articles will help you analyze your results in more detail and turn data into specific actions that improve your brand visibility in AI.